Diagram Demo: Mermaid + TikZ
This page demonstrates both Mermaid (native Markdown) and TikZ (compiled to SVG) diagrams.
Mermaid Diagrams
Mermaid diagrams are rendered natively by the documentation engine.
Flowchart
flowchart TD
    A[Start] --> B{Is it working?}
    B -->|Yes| C[Great!]
    B -->|No| D[Debug]
    D --> E[Fix it]
    E --> B
    C --> F[End]
Sequence Diagram
sequenceDiagram
    participant User
    participant Browser
    participant Server
    participant Database

    User->>Browser: Enter query
    Browser->>Server: HTTP GET /search?q=...
    Server->>Database: SELECT * FROM docs
    Database-->>Server: Results
    Server-->>Browser: JSON response
    Browser-->>User: Render results
State Diagram
stateDiagram-v2
    [*] --> Idle
    Idle --> Processing: submit
    Processing --> Success: valid
    Processing --> Error: invalid
    Success --> Idle: reset
    Error --> Idle: retry
    Success --> [*]
Gantt Chart
gantt
    title Project Timeline
    dateFormat  YYYY-MM-DD
    section Planning
    Requirements    :a1, 2024-01-01, 7d
    Design           :a2, after a1, 5d
    section Development
    Implementation   :a3, after a2, 14d
    Testing          :a4, after a3, 7d
    section Deployment
    Release          :a5, after a4, 3d
Class Diagram
classDiagram
    class Animal {
        +String name
        +int age
        +makeSound()
    }
    class Dog {
        +String breed
        +fetch()
    }
    class Cat {
        +String color
        +climb()
    }
    Animal <|-- Dog
    Animal <|-- Cat
TikZ Diagrams
TikZ diagrams are written as .tex files, compiled to SVG, and embedded as images.
Shannon Communication Model
File: assets/tikz/diagram.tex → assets/tikz/diagram.svg

Classic Shannon-Weaver communication model with Information Source, Transmitter, Channel, Noise Source, Receiver, and Destination.
Binary Entropy Function
File: assets/tikz/binary-entropy.tex → assets/tikz/binary-entropy.svg
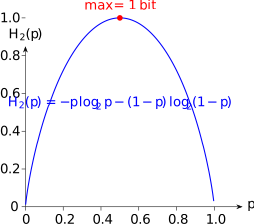
The binary entropy function \(H(p) = -p \log_2 p - (1-p) \log_2 (1-p)\), fundamental to information theory.
State Machine (Shannon Paper)
File: assets/tikz/shannon-state-machine.tex → assets/tikz/shannon-state-machine.svg
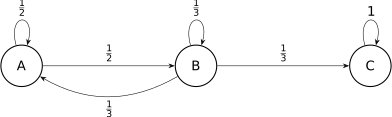
Markov process state transition diagram from Shannon's "A Mathematical Theory of Communication".
Algorithm Flowchart
File: assets/tikz/flowchart.tex → assets/tikz/flowchart.svg
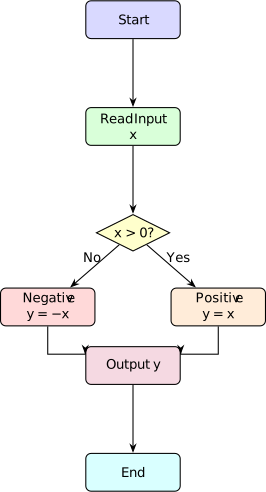
A simple flowchart demonstrating conditional logic with mathematical notation \(x > 0\).
Neural Network Architecture
File: assets/tikz/neural-network.tex → assets/tikz/neural-network.svg
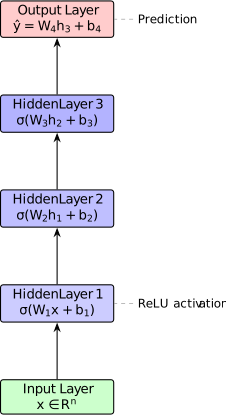
Feed-forward neural network with input, hidden, and output layers. Each layer shows the mathematical transformation.
Maths Encyclopedia Kit (Default Preamble)
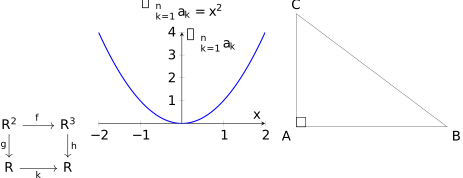
File: assets/tikz/math-kit.tex → assets/tikz/math-kit.svg
No
\documentclassneeded — bare diagram sources are auto-wrapped with the
default math preamble (amsmath,amssymb,tikz,pgfplots,tikz-cd,tkz-euclide). One source shows all three families: a commutative diagram,
a function plot, and a Euclidean construction.
Comparison
| Feature | Mermaid | TikZ |
|---|---|---|
| Syntax | Text-based, simple | LaTeX-based, powerful |
| Math support | Limited / Unicode | Full LaTeX math |
| Custom styling | Theme-based | Pixel-perfect control |
| Compilation | None (native) | Requires latex → dvisvgm |
| Best for | Quick diagrams, collaboration | Publication-quality, complex math |
| Version control | Friendly | Friendly (source is text) |
Build Process for TikZ
# 1. Compile .tex to .dvi
latex -interaction=nonstopmode diagram.tex

# 2. Convert .dvi to .svg (fonts embedded, text stays selectable)
dvisvgm diagram.dvi -o diagram.svg

# Or use pdf2svg:
pdflatex diagram.tex
pdf2svg diagram.pdf diagram.svg
Bare sources (no \documentclass) are wrapped with the default math preamble,
so only the picture body needs to be written:
\begin{tikzpicture}
\draw (0,0) -- (1,1);
\end{tikzpicture}
The SVG is then referenced in Markdown as a standard image:
